
International Insights Report
October 2025
Overview
The United States-Mexico-Canada Agreement (USMCA), which took effect on July 1, 2020, marks a structural modernization of the North American Free Trade Agreement (NAFTA) that had been in place since January 1, 1994. It emphasizes digital economy integration, regional supply chain resilience, and worker and environmental protections, both at the national and regional levels. The agreement also maintains the benefits of reduced trade barriers and deep economic collaboration, particularly in sectors such as manufacturing, energy (oil, gas, minerals), and agriculture and livestock.
An analysis of foreign direct investments (FDI) to the United States from Mexico and Canada over the past decade indicates that Canada has consistently outperformed Mexico in both project volume and impact. The U.S. attracted 1,559 Canadian projects, compared to 148 from Mexico, with Canadian investments generating 135,713 jobs, substantially higher than 16,262 jobs created by Mexican projects. Moreover, Canada’s total capital expenditure reached approximately $100.07 billion, far exceeding Mexico’s $9.41 billion, and a larger number of Canadian firms have established a U.S. presence (977 versus 96 from Mexico).
Mexico and Canada Investments to U.S.
1,707
Total Projects
$109.5B
Total Capex
151,975
Total Jobs
1,073
Total Companies
Arizona continues to experience strong cross-border trade with both Mexico and Canada, driven by rapid growth in logistics, supply chain infrastructure and agribusiness. Since 2003, Arizona has emerged as a leading destination for cross-border investments, ranking 11th among U.S. states for projects from Canada and 7th for those from Mexico. Both rank second-highest in estimated capital expenditures among the top-15 destination states.
Source: FDI Markets database; Source Market: United States; Destination Markets: Mexico, Canada; Date Range: January 2015 to September 2025; numbers include estimates; $ equals USD
Arizona Aggregate FDI Flows from Mexico and Canada, Jan. 2015–Sept. 2025
| Destination State | Source Market | Number of Projects | Capex ($ M) | Avg. Capex ($ M) | Jobs Created | Avg. Jobs | Companies |
|---|---|---|---|---|---|---|---|
Arizona |
Canada |
53 |
4,511 |
85.1 |
6,696 |
126 |
46 |
Arizona |
Mexico |
3 |
55.7 |
18.6 |
257 |
85 |
3 |
Source: FDI Markets database; Source Markets: Mexico, Canada; Destination Market: Arizona ; Date Range: January 2015 to September 2025; numbers include estimates; $ equals USD
Exports & Imports
The three member nations have collectively benefited from FDI, which has driven infrastructure expansion, capital inflows, economic growth, market diversification, and enhanced competitiveness, among other advantages.
Since USMCA, some notable differences are:
- Mexico became the United States’s top goods trade partner in 2023, accounting for 15.62% of total U.S. trade, followed by Canada at 15.2% and China at 11.3%.
- U.S. imports from Mexico rose to 15.42% of total imports in 2023, surpassing imports from China, which fell to 13.85%. In 2019, (pre-USMCA), the situation was reversed: Imports from China were at 18%, while Mexico’s share was 14.29%.
U.S. goods and services traded within the USMCA area totaled an estimated $1.6 trillion in 2024. Exports were $683.9 billion; imports were $917.4 billion. U.S. goods exports to Mexico and Canada in 2023 were $678 billion, down 1.1% ($8 billion) from 2022, and up 24.5% from 2019. U.S. goods imports from Mexico and Canada totaled $917.4 billion in 2024, up 3% ($26.4 billion) from 2023, and up 36% from 2019. U.S. exports to Mexico and Canada accounted for 33% of overall U.S. exports in 2024.
| Country | Exports ($ B) | Imports ($ B) | Total Trade ($ B) | % of Total Trade |
|---|---|---|---|---|
Total, All Countries |
2,061 |
3,266.40 |
5,327.40 |
100% |
Mexico |
334 |
505.5 |
839.5 |
15.76% |
Canada |
349.9 |
411.9 |
761.8 |
14.30% |
China |
143.2 |
438.7 |
581.9 |
10.92% |
Germany |
75.7 |
160.3 |
236 |
4.43% |
Japan |
78.9 |
148.3 |
227.2 |
4.26% |
Source: International Trade Administration of U.S. Department of Commerce; U.S. Census Bureau, Trade by Country, 2024. Data are goods only, year-to-date total trade in billions of U.S. dollars, unrevised
Imports from Mexico and Canada include agricultural products; computer and electronic products; transportation equipment; electrical equipment; appliances and components; and machinery, except electrical, indicating a reciprocal trade relationship that supports various sectors within Arizona.
Mexico
Arizona’s trade ties with Mexico remain significant, with the top five exports in 2024 including metal ores; computer equipment; semiconductors and other electronic components; electrical equipment and components; and electrical equipment.
Canada
Arizona maintains a strong trade relationship with Canada. In 2024, the state’s leading exports included vegetables and melons; aerospace products and parts; engines and power transmission equipment; semiconductors and electronic components; and motor vehicles, among others.
Focusing specifically on the Greater Phoenix region, the following graph illustrates the trends in trade activity over recent years.
Greater Phoenix Goods Export Markets
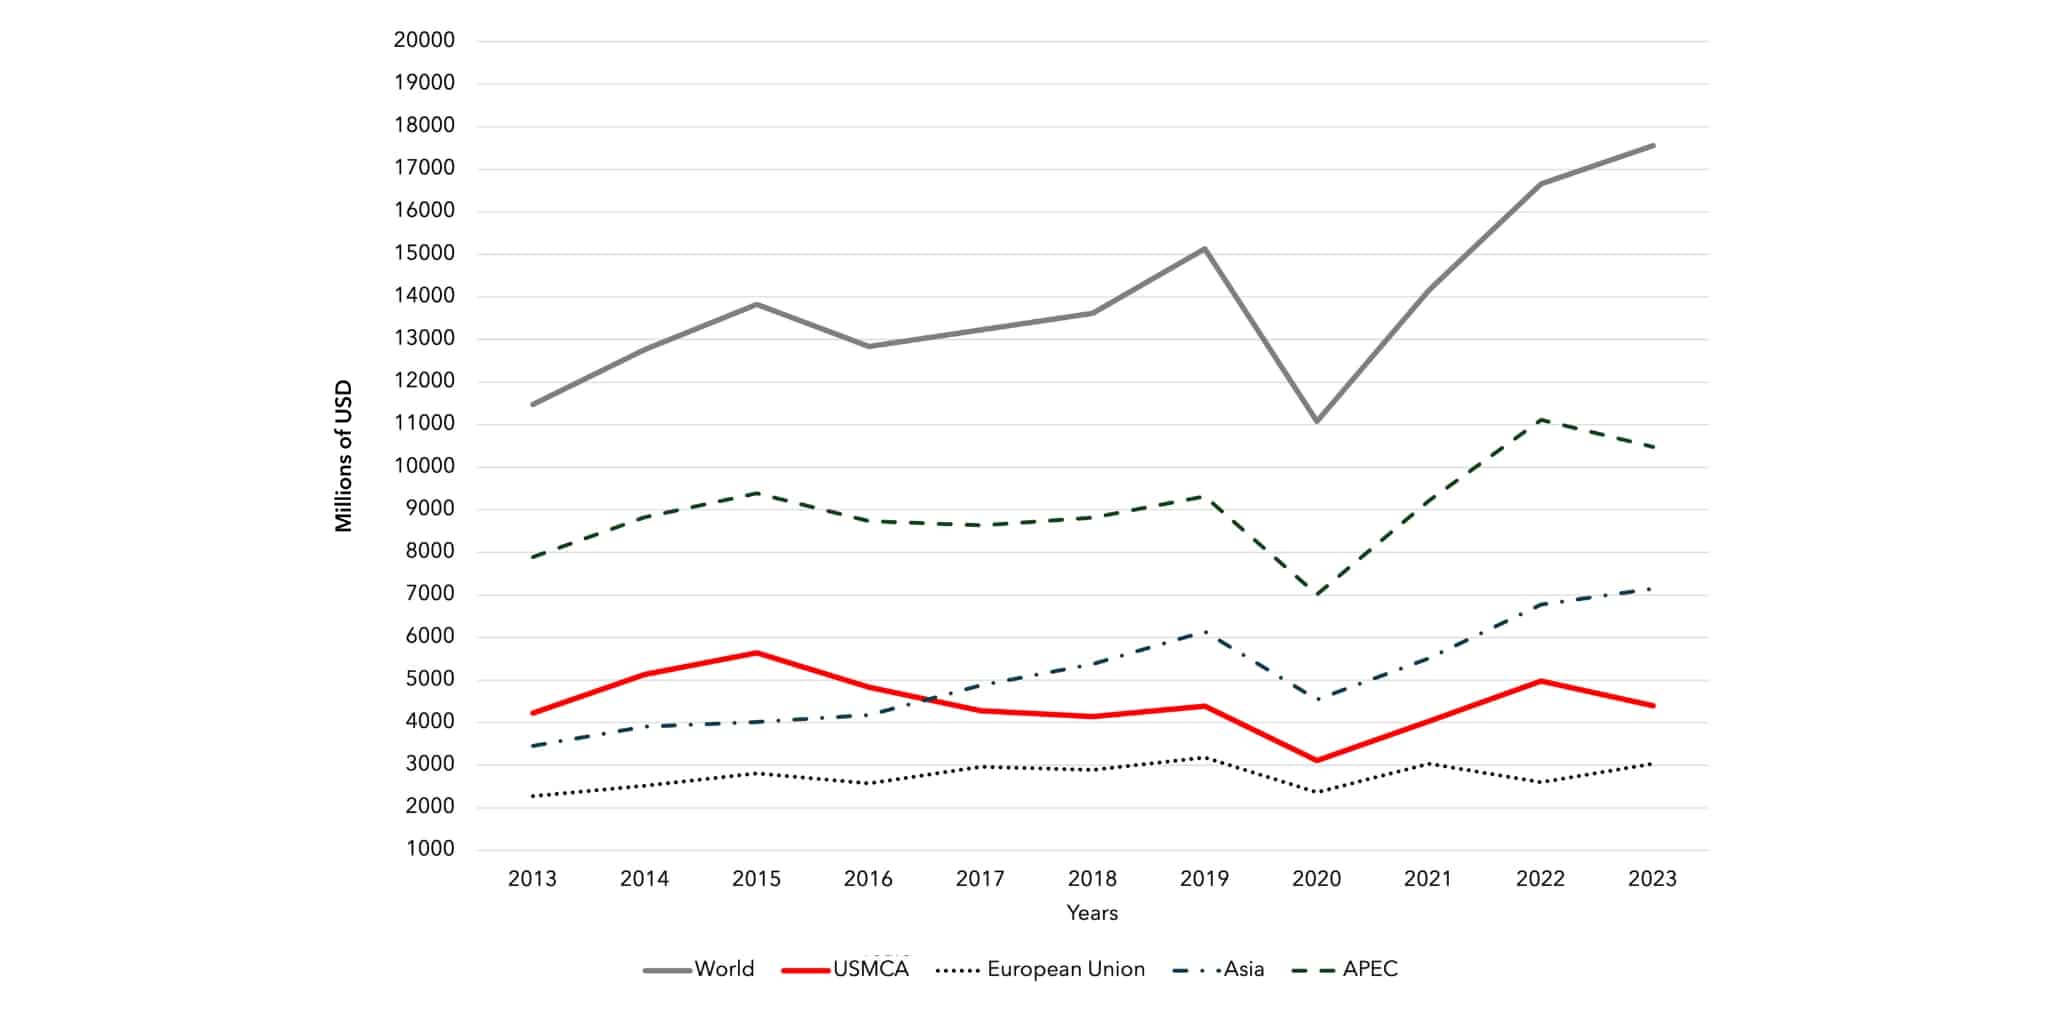
Source: International Trade Administration; Metropolitan Area goods export markets, November 2024; Asia includes East Asia, Southeast Asia and South Asia; APEC is the Asia-Pacific Economic Cooperation
Infrastructure Investments Boosting FDI & Trade
Some positive economic implications from infrastructure investments that have facilitated trade efficiency with Mexico and Canada overall include:
U.S. – Mexico Border
- The Laredo, TX crossing (World Trade Bridge) is the busiest land port for U.S.-Mexico trade. Significant investments have gone into expanding lanes, inspection facilities and implementing non-intrusive inspection technology.
- The Otay Mesa East Port of Entry (California-Baja California), expected to open in 2026, is a more than $1 billion project designed to reduce congestion and wait times.
U.S. – Canada Border
- The Gordie Howe International Bridge (Detroit, MI-Windsor, ON), scheduled to open in 2025, is one of the largest bi-national infrastructure projects and will improve freight movement across the busiest U.S.-Canada trade corridor.
- Upgrades at the Peace Bridge (Buffalo, NY-Fort Erie, ON) and Blue Water Bridge (Port Huron, MI-Sarnia, ON) have also been critical to improving cross-border flow.
Key Arizona Infrastructure Investments to Boost Trade Include:
| Infrastructure Type | Key Projects & Benefits |
|---|---|
Air Logistics |
SkyBridge via Mesa Gateway Airport: The nation’s only inland international air logistics and customs facility with joint U.S.-Mexico customs inspections, designed to lower customs friction and boost regional trade readiness. |
Border Crossings |
Port Upgrades at Nogales, Douglas & San Luis: Funded through the Infrastructure Investment and Jobs Act to expand capacity, safety and efficiency of U.S.-Mexico trade. |
Highways |
State Route 189: Enhancements to the main link between Interstate 19 and Nogales-Mariposa Port of Entry, improvements to boost corridor safety and efficiency as part of the larger CANAMEX freight network. |
Rail Network |
Rail Safety & Intermodal Logistics Upgrades: Arizona received $46.4 million to expand rail freight capabilities and improve safety across several locations, including Gilbert, Marana, and Yuma. Projects include eliminating at-grade crossing and enhancing traffic flow. |
Source: Arizona Department of Transportation, Center for American Progress and H.R.3684 – 117th Congress (2021-2022): Infrastructure Investment and Jobs Act. (2021, November 15). https://www.congress.gov/bill/117th-congress/house-bill/3684
Challenges Under USMCA
The distribution of benefits among the U.S., Mexico and Canada has been uneven, with exposure to international competition reducing economic opportunity and increasing insecurity for certain sectors in all three countries. (Burfisher, Lambert, and Matheson, 2019). Other challenges lie in auto rules of origin, labor rights enforcement, dairy and agriculture disputes, energy policies, environmental concerns, and digital trade regulations – all of which test the agreement’s balance between free trade and national interests.
For instance:
Automotive Rules of Origin
The USMCA introduced stricter requirements for vehicles to qualify for tariff-free trade – 75% North American content, up from 62.5%. This could potentially increase production costs and bring about supply chain complexities for automakers.
Agriculture & Dairy Market Access
The U.S. argues that Canada’s quota system still restricts American dairy exports. In addition, fresh produce trade, from the perspective of both the Mexican importers and U.S. seasonal growers, remains a friction point.
Digital Trade & Data Privacy
The USMCA introduced rules on cross-border digital trade but differing national regulations on privacy continue to create uncertainty.
Political & Economic Tensions
Evolving geopolitical tensions and shifting trade policies across North America are reshaping the landscape for cross-border investment and trade. In both Mexico and Canada, domestic political dynamics are increasingly influencing economic decision-making, which might lead to policy uncertainty or protectionist tendencies that could challenge the stability of the USMCA framework. Rising concerns over energy sovereignty in Mexico, debates on industrial policy and carbon regulations in Canada, and the United States’ emphasis on supply-chain security and reshoring are introducing new layers of complexity to regional trade relations. While these developments may spur greater intra-regional collaboration in strategic sectors such as clean energy, semiconductors, and critical minerals, they also risk policy friction and regulatory divergence that could affect investor confidence and long-term FDI flows within North America.


Future Outlook & Opportunities
Agriculture & Agtech
Advancements in precision agriculture, water-efficient farming, and agtech innovation present strong opportunities for cross-border market expansion. With stable tariffs and reduced trade uncertainty, there is significant potential for collaborative U.S.-Mexico research focused on desert agriculture and the development of climate-resilient crops.
Intellectual Property
Stronger protections for intellectual property and regulatory cooperation encourage research and development, especially given that Arizona’s universities and research institutions can collaborate with Mexican and Canadian counterparts to expand in biotechnology, pharmaceuticals, and medical devices across North America.
Decoupling & Reshoring
There is a trend of diversifying manufacturing bases, with some operations shifting from other nations to the U.S. Southwest, including Arizona, to mitigate risks and leverage local advantages.
Renewable Energy & Green Infrastructure
Collaborations in solar energy technologies and hydrogen projects are expected to increase, growth in electric vehicle supply chains – from battery production to charging infrastructure – thereby elevating Arizona’s renewable energy goals.
Support for USMCA
GPEC has assisted 23 companies from Mexico and Canada in establishing operations in Greater Phoenix between January 2015 and September 2025. Companies headquartered in the region recognize Arizona’s pro-business climate, strategic proximity to California- the world’s fifth-largest economy, and exceptional quality of life. Renewal of the USMCA is vital to sustaining and attracting continued investment from Mexican and Canadian based firms in the region.
Download the PDF on the U.S., Mexico & Canada Report.


Industry Expert
Casey Gilchrist
Vice President, International Business Development
Published: 10/28/2025